Advanced Monitoring Platform for Real-Time Data Analysis and Insights

Still deciding? Get samples of $ !
Order Sample

Product Description

Basic Specifications
Model NO.
None
Client Software
Monitoring Platform
Transport Package
Carton, Wooden Case, Custom Packaging
Origin
Changsha City, China
Production Capacity
200,000 Pieces/Year
Package Size
49.50cm * 31.50cm * 35.50cm
Monitoring System Software Platform

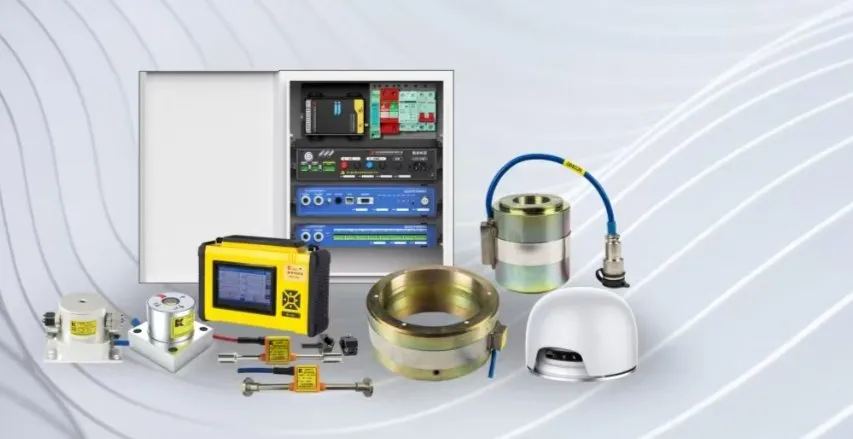
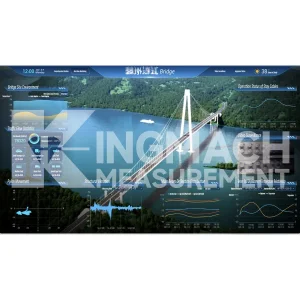
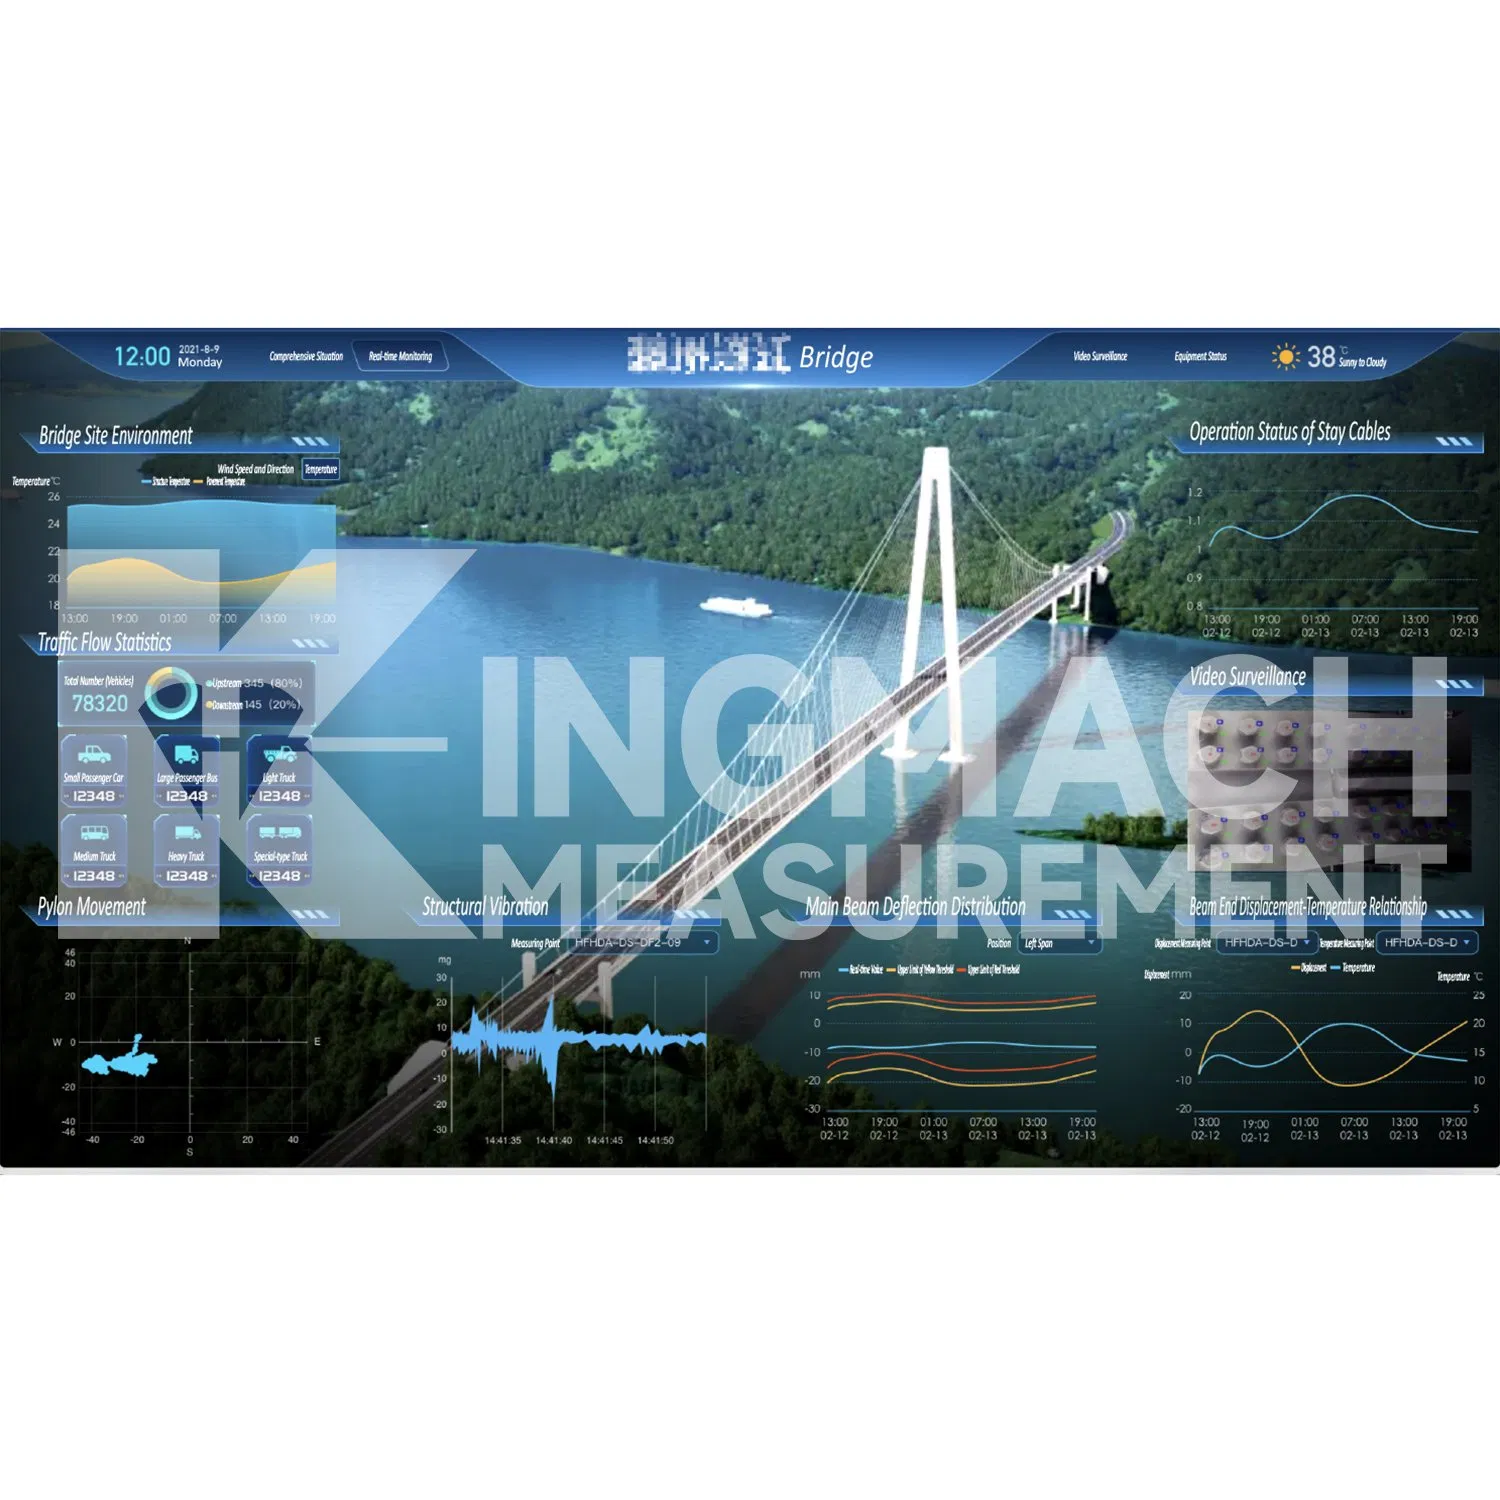
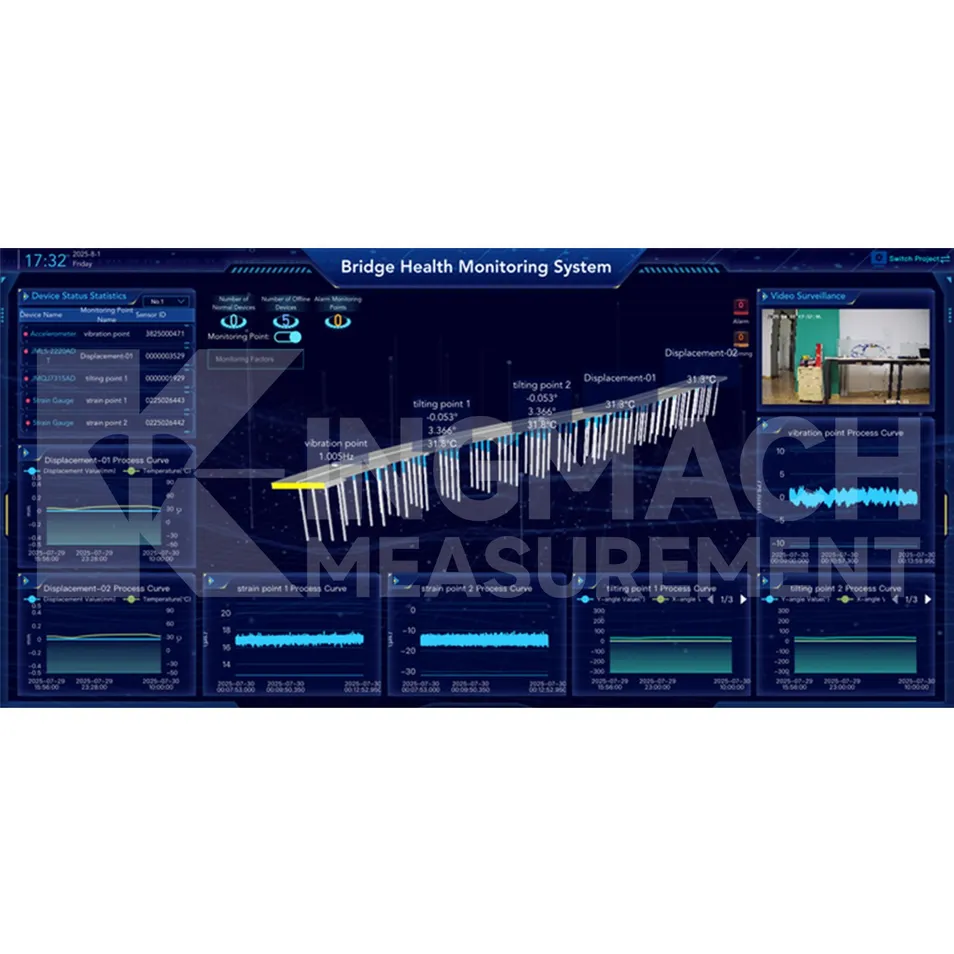
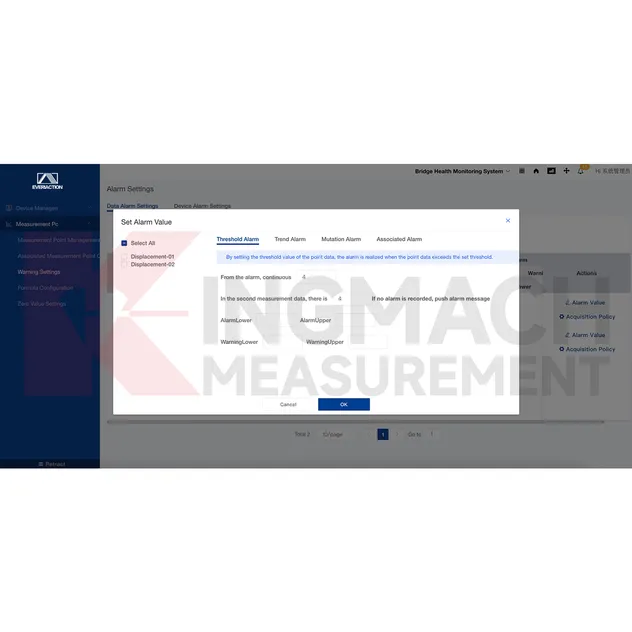
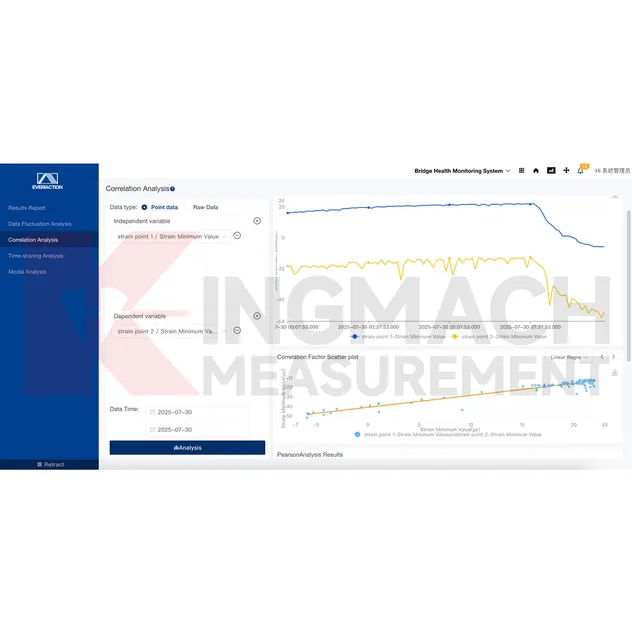
The Monitoring System Software Platform (hereinafter "Cloud Platform") is built on Internet of Things (IoT), big data, and cloud computing technologies. It enables all-round safety monitoring of civil engineering structures and delivers a full set of solutions for customers. The platform is compatible with hardware devices from different manufacturers and models, supporting data transmission via both wired and wireless means.

Advanced Monitoring Platform
Real-Time Data Analysis

Core Features

  • Data Security: Uses multiple security protocols for fast storage and real-time filtering.
  • Intelligent Analysis: Builds structural safety models using algorithms to determine damage location and extent.
  • Health Warnings: Conducts health analysis and warns of performance changes in structural integrity.
  • Alarm Mechanism: Flexible rule configuration providing detailed fault information and reference solutions.
  • Unitized Management: Employs project management methods to track inspection, maintenance, and documentation.
Technical Specification
Place of Origin Changsha, China
Minimum Order Quantity 1 Piece
Price Negotiable
Payment Terms T/T in advance
Monitoring Interface 1
Monitoring Interface 2
Monitoring Interface 3
Service Capability
Global Engineering Services

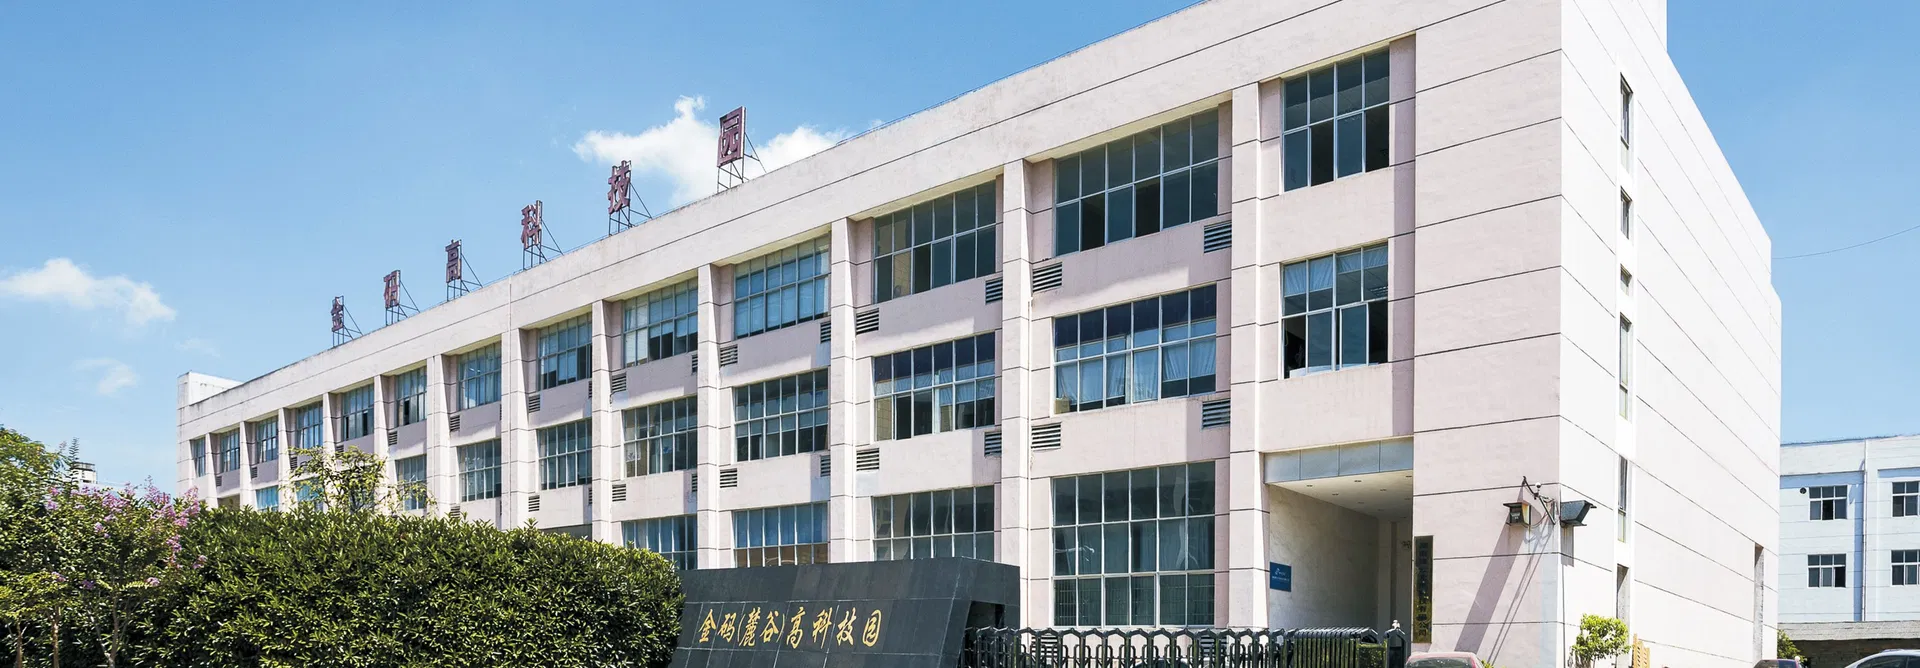
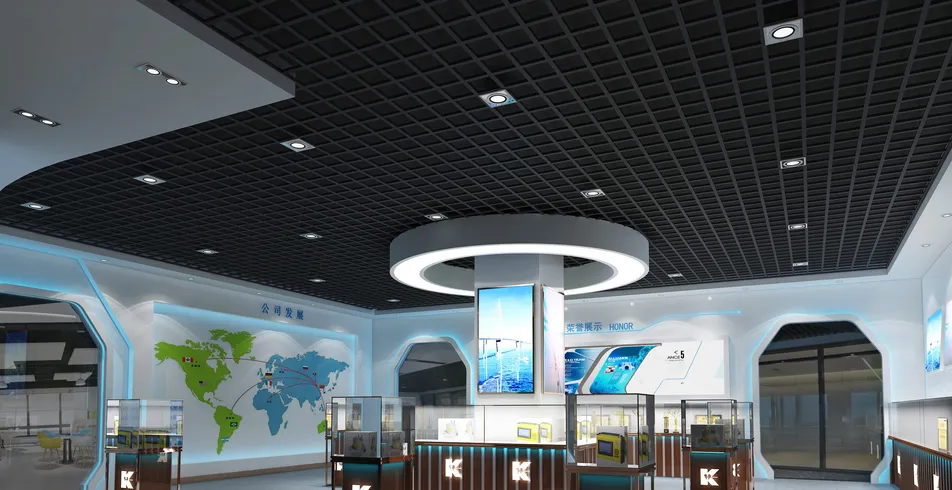
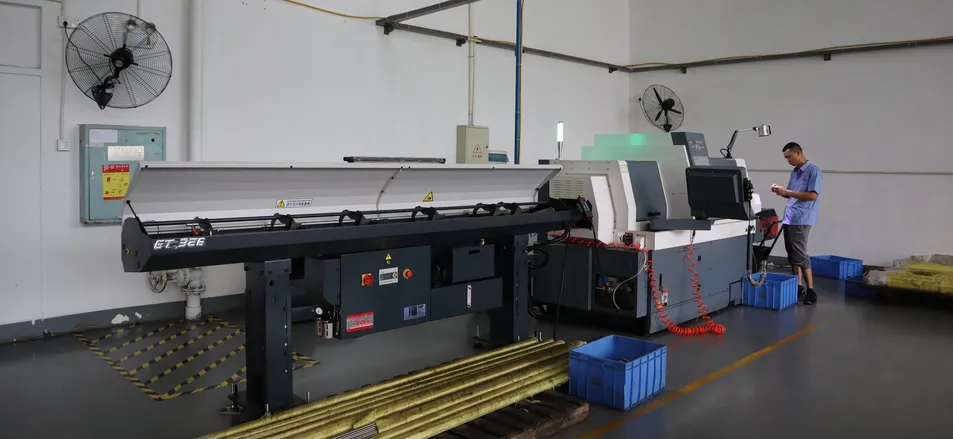
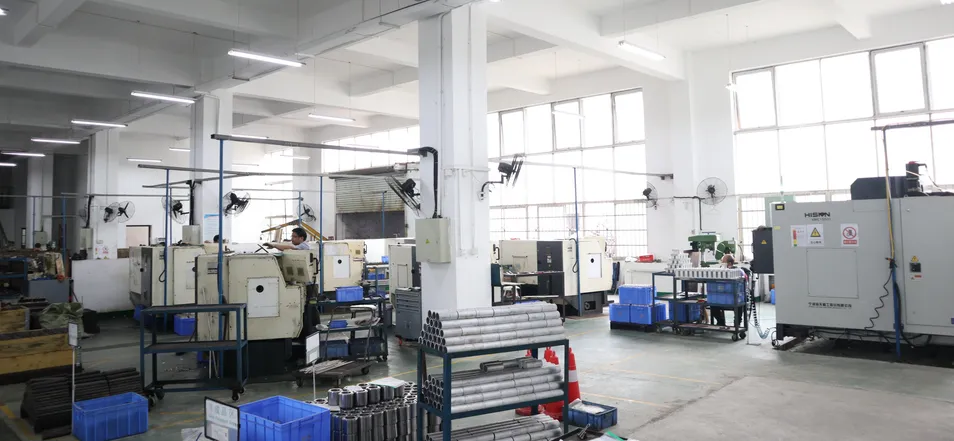
Providing system solutions for engineering testing and related fields since 2001, our business covers both domestic and international markets, serving over 80% of national key projects. We offer one-stop services for engineering installation and smart cloud monitoring.

Hardware Solutions
Software Services
Frequently Asked Questions
Q1: What are the reasons for no data from the measuring point?
1. The device is offline. Check the software status. 2. The device is online but DTU frequency is not set, the formula is missing, or data transmission is abnormal due to format errors.
Q2: Why does "Command is being executed" appear during debugging?
This indicates that data acquisition is currently in progress. Please wait a moment and try again.
Q3: What should I do if there is a connection timeout?
This is usually caused by the device being offline or network delay. Please check your network stability and try again later.
Q4: How can I view data from multiple points on one interface?
In the key data curve section, you can display multiple curves simultaneously through key monitoring configuration or by using the multi-selection feature in the measuring point data curve interface.
Q5: How do I analyze the reasons for abnormal data points?
Consider site conditions like unstable voltage or construction interference. Use "Measuring Point Curve Analysis" to verify original data, formula settings, zero point values, and calculation logic.
Q6: How is normal data upload verified?
Check the [Original Data Curve] after configuring the device and frequency. For [Immediate Acquisition], data should appear instantly. For [Timed Acquisition], data will collect based on the set interval.
Data Visualization
System Analysis
Monitoring Banner

Related Products